Presenting Traction Data When Numbers Are Early
How to present early traction without overselling thin data.

CRV research shows seed traction expectations have jumped roughly 75% since 2021. That single number explains why so many founders walk into pitch meetings feeling like the ground shifted under them. The ground has shifted under them. What used to clear the bar at Series A now gets asked of seed-stage companies, and founders who don't know this yet are showing up to a different fight than the one they trained for.
Part of the distortion traces back to where capital actually flows. Crunchbase News data shows that more than 70% of global startup capital in the second quarter of 2026 went to AI-focused companies, and those mega-rounds do something subtle to investor psychology: they become the anchor. When a partner has spent the morning looking at a nine-figure AI raise, a seed deck with modest monthly revenue and a handful of pilot customers reads smaller than it would have three years ago, even though the underlying business has stayed the same. Meanwhile, the instruments founders use to raise are consolidating. Carta's analysis of financing data shows that pre-seed SAFEs and convertible notes fell 13% year-over-year in 2025, even as the number of first-time financings held up. Fewer instruments, same dollars, concentrated into fewer winners. Investors are pattern-matching against outliers, and founders with honest, early-stage numbers get penalized before they've said a word.
None of this is a presentation failure. It's structural, and that changes what the deck is actually for. Dressing up thin data so it looks like something it isn't will not fix a structural mismatch between what the market now expects and what an early company can show. The job is strategy: building a narrative that makes early signal legible as evidence, without pretending the evidence is bigger than it is.
What "traction" means at each stage, and why the definition changes the presentation task
Traction is stage-relative, and misjudging your own stage is usually the first mistake a founder makes on the slide, before a single metric even gets read.
Founder Institute's benchmarks lay out the spectrum. An accelerator-stage company is expected to show customer validation, an MVP with real users, and somewhere between $1,000 and $10,000 in monthly revenue. Pre-seed raises the bar slightly: early production-level product, with monthly revenue expectations climbing above the accelerator floor. Seed expects evidence of product-market fit and a more solid product, with monthly revenue expectations meaningfully higher than pre-seed. By Series A, investors want expansion signal stacked on top of a commercial product generating $200,000 or more a month.
Industry changes the math further. SaaS companies at the accelerator stage get judged on executed proofs of concept and paid pilots, climbing to $5,000 to $25,000 in monthly recurring revenue by pre-seed. Consumer startups get measured in daily active users: 1,000-plus at accelerator stage, 5,000-plus with real engagement by pre-seed. Deep tech runs on an entirely different clock. For deep tech at pre-seed, strong leadership, letters of intent, and proofs of concept tend to serve as the expected proof set, and revenue simply isn't part of the ask yet.
The narrative carries more weight than the data early on, and that ratio flips as rounds get bigger. At pre-seed, the story and the team do most of the persuading. Ainna.ai's breakdown of pitch deck construction shows that by Series A, the numbers are expected to speak for themselves. A founder's real job is proving they understand exactly which game they're playing, so the evidence on the slide matches the stage it's arguing for. CRV's guide comparing seed and pre-seed positioning makes the point bluntly: committing to the wrong lane wastes months of investor conversations that were never going to close, because the ask never matched the evidence.
The hierarchy of early signals, from letters of intent to retention data
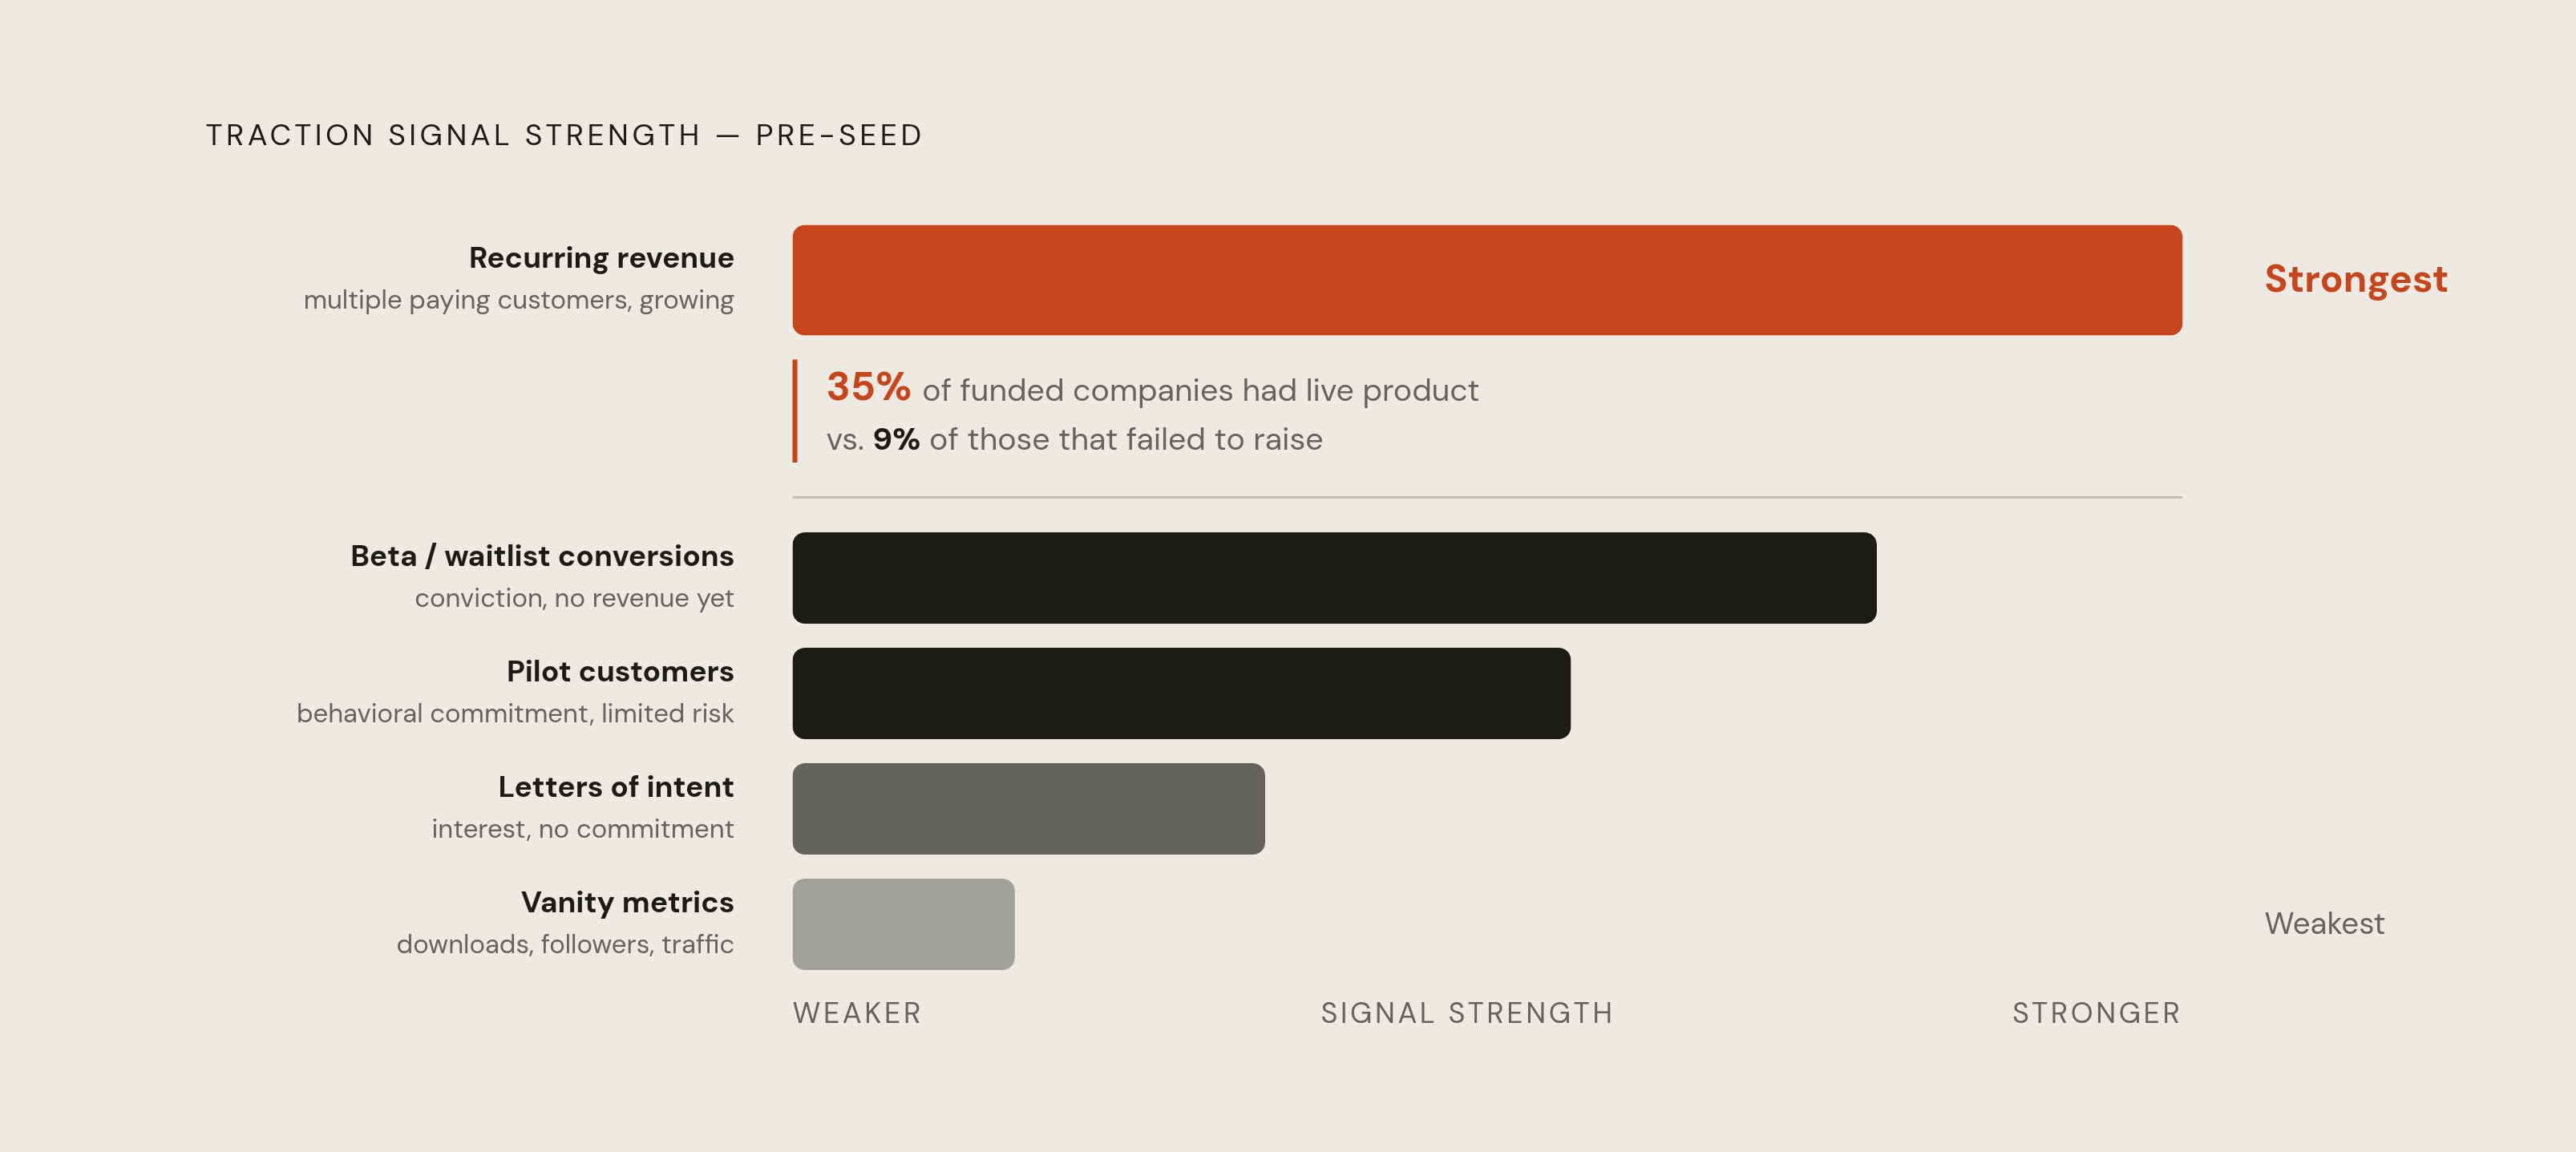
Traction lives on a spectrum, not a yes-or-no switch, and investment experts rank the signals in a clear order of strength. Letters of intent sit at the bottom. They show interest, not behavior; a prospect saying "we'd buy this" costs them nothing. Pilot customers rank higher, because a pilot involves actual behavioral commitment, even if the financial risk on the customer's side stays limited. At the top sits the real prize: multiple recurring, paying customers with revenue that's growing, not flat.
CRV identifies waitlist conversion rates, LOIs, and strong engagement metrics as the credible fallback signals without revenue yet, the kind that show target customers have enough conviction to act before money changes hands. Guidance from Waveup shows that qualitative evidence fills in the rest: beta subscriptions, unpaid pre-orders, testimonials, established partnerships, direct customer quotes, and case studies all carry real weight on a deck.
Retention, when a founder has it, outranks almost everything else. Any competent marketer can juice a signup number for a quarter. Retention is harder to fake, because it means the product solved a real, recurring pain rather than capturing a moment of curiosity. The underlying logic is consistent with CRV's broader guidance: a customer base that's smaller but growing consistently outweighs a larger base that's gone flat.
Vanity numbers no longer work: downloads, follower counts, raw website traffic used to fill space on early decks. None of these prove behavior or willingness to pay, and investors have gotten too good at filtering them out. CRV's 2026 research found that 35% of funded pre-seed companies had a live product already in market, compared with just 9% of companies that failed to raise. Shipping before fundraising is a measurable edge, not a nice-to-have.
The practical move is an honest audit. Rank what you actually have against this hierarchy, and lead with the highest-tier evidence you can defend under questioning, not the number that sounds biggest sitting alone on a slide.
Building a Narrative Architecture Around Thin Data
Transparency isn't a weakness to manage around. Investors already know early-stage companies have limited data; that's built into the stage. Visible's guide to seed decks shows that hiding a gap reads as evasion, while naming it reads as self-awareness, and self-awareness is a trait investors are explicitly screening for.
Structurally, the strongest decks open with a market truth before a product feature. The first slide should answer why this moment exists, why now, before anything about what got built. That ordering matters because it sets the investor's interpretive frame before they've had the chance to build their own, less favorable one, per pitch deck construction guidance for early-stage founders.
From there, A well-structured traction slide addresses three questions in order: what growth signal proves something real has been found, what retention or efficiency proof shows that finding is durable, and what external validation, whether logos, press, or partnerships, de-risks the bet for someone about to write a check. A deck that answers all three, even briefly, does more work than one that dumps six metrics without organizing them around a question.
Lead with a single number that isn't a vanity metric: ARR growth, active user growth, or LOI volume, positioned top-left where it gets seen first, with context stacked underneath it. Waveup's analysis of more than 800 deck rebuilds found this placement and hierarchy correlates directly with how decks perform in the room.
When a metric is messy but trending the right way, the fix isn't to smooth it over. Smoothing it over is exactly the wrong instinct. The fix is to tell the learning loop: what changed, why it changed, what the team did in response. Gritt.io's research on seed-stage narratives notes that a metric which looks rough on its face can still persuade, provided the causal story around it is clear and the founder clearly understands their own number. A CAC figure without the channel behind it, or an NRR number without an explanation of whether the movement came from expansion, seat growth, or pricing changes, invites the exact follow-up question that stalls momentum in the room.
Qualitative evidence isn't filler dropped in to pad a thin slide. Customer quotes, pilot results, early user feedback: these are narrative infrastructure, the connective tissue that makes a quantitative claim legible to someone who's never met the customer. Present early data as evidence of a theory currently being tested. Investors are looking for a learning loop at this stage, not a finished revenue line.
Where Founders Lose Investors on the Traction Slide
The 2025 Pitch Deck Report cited by Waveup shows that investors spend roughly three times longer on the traction slide than on any other page in a seed deck, which makes it the single highest-scrutiny page a founder will present. That same report shows that 76% of "no" decisions cite weak traction as the stated reason. Weak traction is not the same thing as no traction. More often, it means real traction that got framed badly, buried, or explained without the context that would have made it land.
Time pressure makes this worse. DocSend data cited by Startupa.ge shows seed-stage decks get about one minute and fifty-six seconds of total review time on average, and Waveup finds investors decide in roughly twenty seconds whether a given slide has earned them the right to keep reading. Burying the strongest metric three lines down on a dense slide costs founders attention they don't get back, and no amount of polish recovers it later in the deck.
Qubit Capital data shows that only about 1% of pitch decks secure funding, which makes the stakes concrete. That statistic doesn't mean decks are pointless. It means the gap between a deck that earns a follow-up meeting and one that gets passed over is almost entirely made of credibility signals, and at seed, traction is the primary one.
The recurring structural errors repeat across failed decks: leading with a vanity metric, showing a number with no explanation of what moved it, presenting growth without any retention context beside it, and dropping a CAC or NRR figure onto the slide as though it were self-explanatory. The fix is editorial. Cut anything on the traction slide that doesn't directly answer one of the three questions laid out above, growth signal, durability proof, external validation, and what's left over is usually stronger for the deletion, not weaker.
Choosing the right storytelling frame for your stage and data set
No single storytelling structure works across every stage and every investor type. Slidegmm.ai's 2026 analysis of pitch deck storytelling patterns across real decks shows that the right frame depends on what data a founder actually has to work with.
Five frameworks recur across pitch decks, each suited to a different situation. Hero's Journey fits vision-heavy pre-seed pitches, where the founder's own story carries most of the persuasive weight because the data simply can't yet. Problem-Agitate-Solve suits B2B SaaS particularly well, laying out the pain point clearly before any numbers arrive to back it up. Before-After-Bridge works when customer transformation is the anchor, letting outcomes do the talking. Why-How-What suits technical founders who need to establish credibility and reasoning before leading with numbers that might otherwise look arbitrary. YC Memo format fits data-rich Series A decks and beyond, where a tight, structured format speeds up comprehension rather than building suspense.
Pitch deck research suggests that VCs process structured patterns faster than narrative arcs. Hero's Journey, specifically, can slow comprehension compared with more structured formats. That's a real cost, and it means the choice of frame isn't just aesthetic, it changes how fast the room actually understands what's on the slide.
For founders with genuinely thin data, Hero's Journey or Why-How-What buys credibility before the numbers have to carry the argument alone. For founders who already have early revenue, Problem-Agitate-Solve or YC Memo format lets that data land cleanly, without needing extra scaffolding to make sense. The room matters as much as the stage: a narrative-first pre-seed angel and a data-first institutional seed fund will read the identical slide completely differently. Knowing which room you're walking into should decide which frame gets used, not habit or preference. Proven examples from Airbnb, Uber, and Buffer show early decks that used one clear approach, not a blend of several, to carry genuinely limited data convincingly.
What investors are benchmarking against, and how to contextualize your numbers accordingly
Investors carry internal benchmarks in their heads, and those benchmarks are frequently distorted by a small number of outliers sitting at the top of the distribution. Data on seed valuations shows the median post-money valuation rose substantially in the fourth quarter of 2025 compared with a year earlier, while the 95th percentile reached a far higher figure that same year. AI mega-rounds pull the average well above what most founders raising a standard seed round should be measuring themselves against.
The number that matters for most founders is the median, not the average, and specifically the median within their own industry vertical, not the market-wide figure. Available data shows that at Series A, median revenue landed at a multiple of that seed-stage figure in 2025, with competitive B2B SaaS raises often falling in a range a couple of times wider still. Series A valuations moved in step: median post-money valuation climbed substantially in the fourth quarter of 2025, up 37% year-over-year.
Phoenix Strategy Group data shows that fewer than 10% of seed-funded startups make it to a Series A. That figure exists to put the odds in context, not to discourage anyone. It's a reason to show an investor, explicitly, why the trajectory sits on the right side of that selection line rather than hoping they infer it. The practical move is to name the benchmark directly in the deck, show where the company sits against it, and explain why the trajectory determines how the gap gets read, turning it into a starting point rather than a shortfall. That turns a gap into a starting point instead of a shortfall.
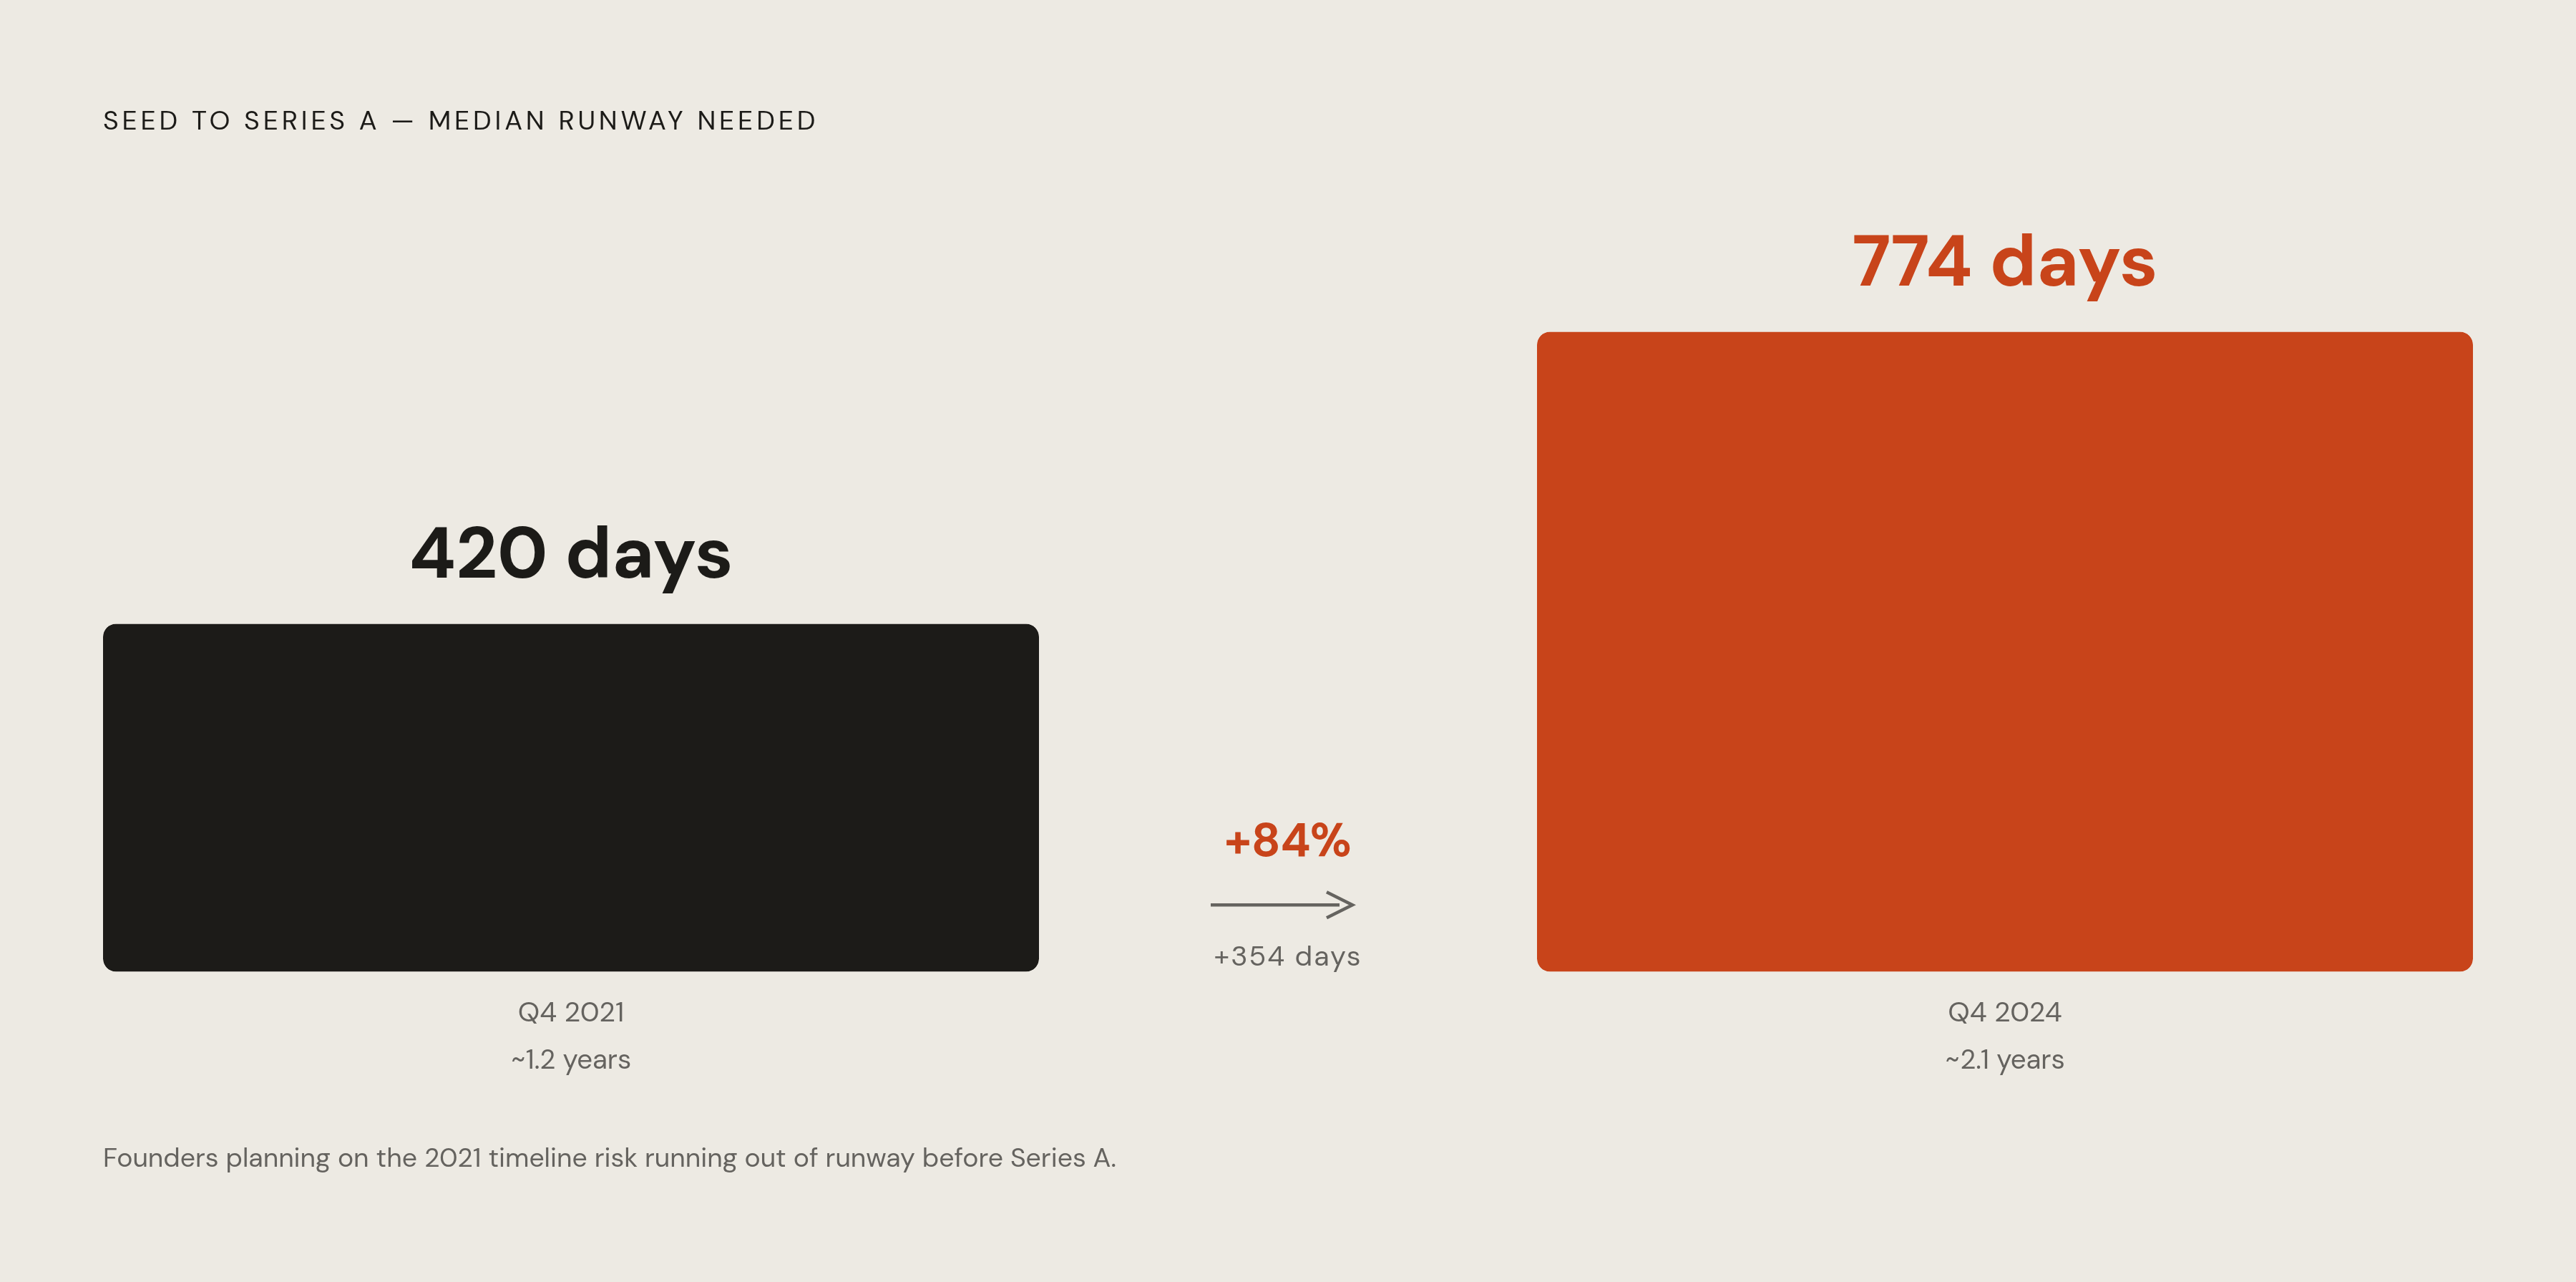
Deep tech offers a useful model here for any founder without revenue yet. Founder Institute's benchmarks show that at pre-seed, strong leadership plus LOIs plus proofs of concept is the expected proof set, and the absence of revenue in that context is normal and stage-appropriate, not a red flag. Time is part of the honest picture too: the median stretch from seed to Series A reached 774 days, roughly 2.1 years, for companies raising a Series A in the fourth quarter of 2024, up from 420 days, about 1.2 years, in the fourth quarter of 2021. That's an 84% increase. Founders who set runway expectations against that real timeline, rather than the faster one that used to be normal, signal a kind of financial maturity investors notice immediately.
Running a disciplined raise process when your traction story is still developing
The traction slide is a live asset that should keep updating as the raise moves forward. Founders who treat it as finished the moment the deck ships are giving up an advantage that compounds with every investor conversation that follows.
Targeting beats volume when the numbers are still early. The right investor for a pre-revenue pre-seed story is a categorically different investor than the right one for a seed company already generating meaningful annual revenue. Sending the same deck to the widest possible list produces mismatched conversations that damage the narrative's credibility before anyone's had a fair chance to hear it out.
Pipeline discipline is the operational half of narrative discipline. Tracking which investors saw which version of the traction story, what they responded to, and what objections came up lets a founder sharpen the framing in real time instead of repeating the same mistake across twenty meetings. The conversation about traction doesn't end when the deck closes, either. It continues in the room, so founders should walk in already knowing which benchmark questions are coming, with the answer ready before anyone has to ask it.
Demo days make this especially visible. A demo day is a starting line, not a finish line, and the founders who actually close rounds are the ones who run their pipeline with the same rigor after the event that they applied to the pitch itself. Investor interest that isn't followed by structured outreach and a clear next step fades fast, usually within days.
A newer layer of tooling has started to change who gets access to that kind of rigor. AI-powered fundraising tools can now handle investor research, outreach sequencing, meeting prep, and pipeline tracking, work that used to require either a deep personal network or a seasoned CFO on staff. The effect brings operational precision to a process that has historically rewarded relationships and luck over preparation.
None of this is about hiding thin traction behind good process. A founder who knows what stage they're at, leads with the strongest honest signal available, measures their numbers against the right benchmark rather than the flashiest one, and runs a structured, disciplined process from first meeting to term sheet is showing the kind of operational maturity that investors, at every stage, are actually betting on.